Clustering by measuring local direction centrality for data with heterogeneous density and weak connectivity (CDC)
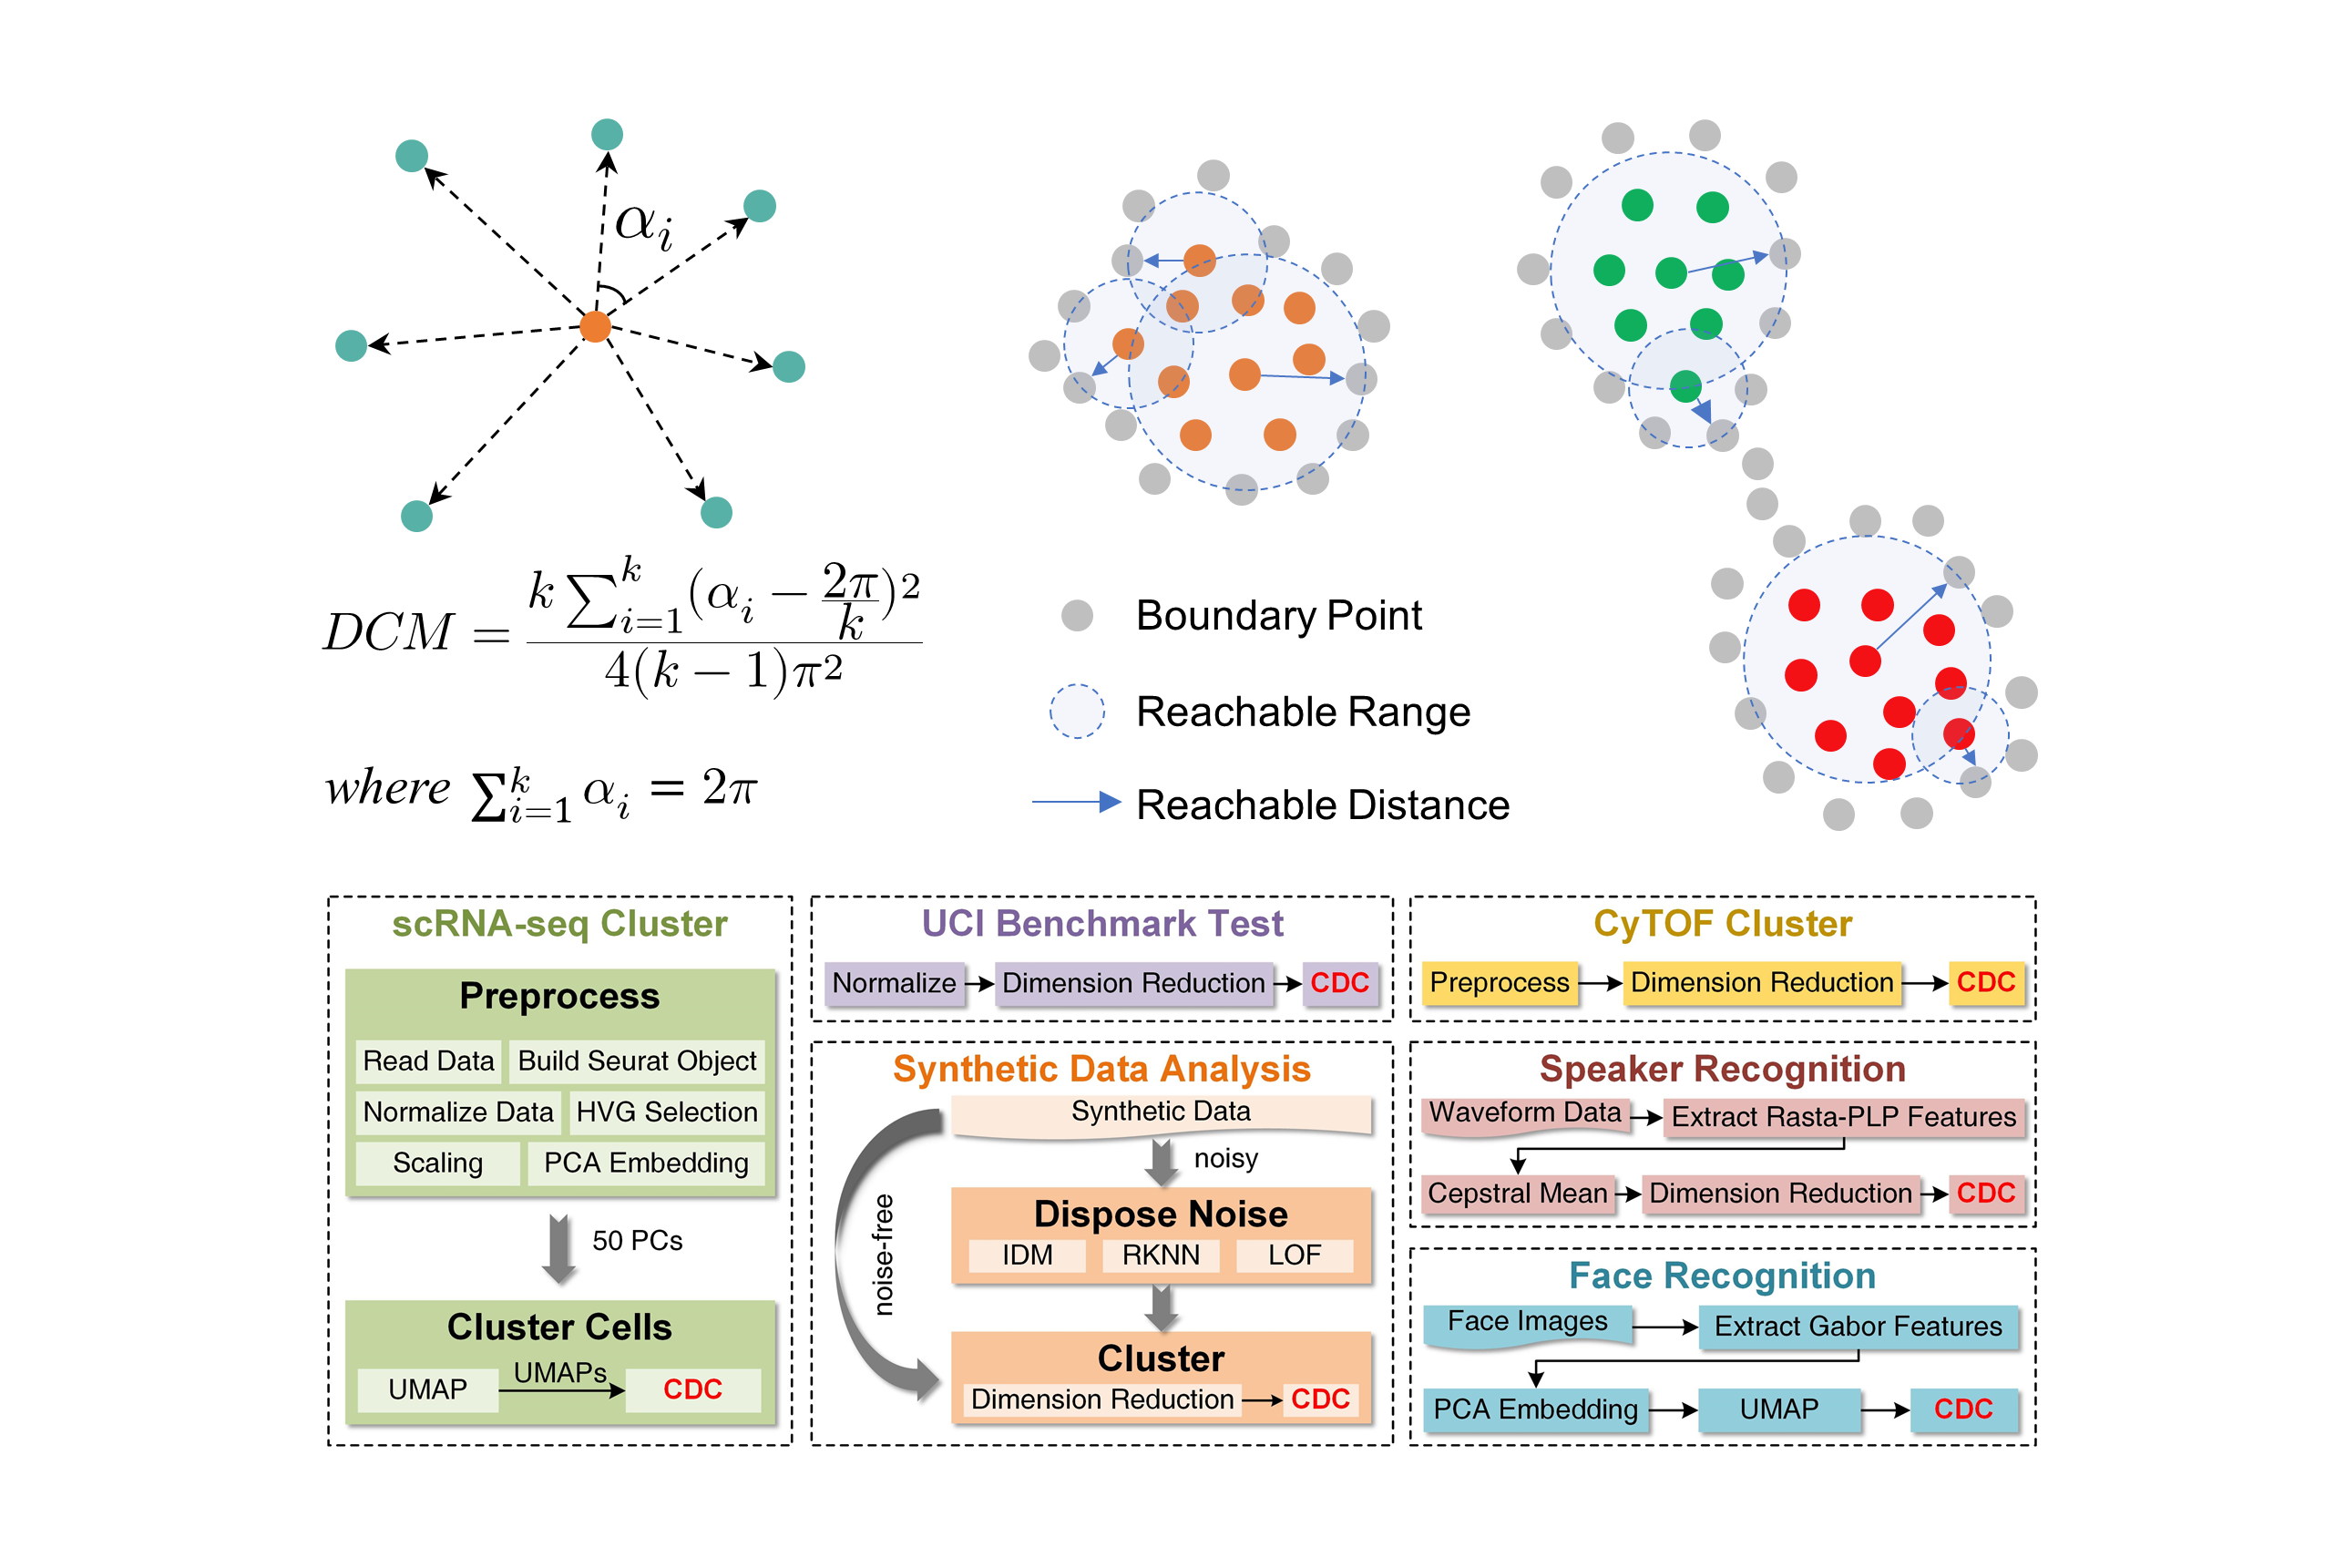
We propose a novel Clustering algorithm by measuring Direction Centrality (CDC) locally. It adopts a density-independent metric based on the distribution of K-nearest neighbors (KNNs) to distinguish between internal and boundary points. The boundary points generate enclosed cages to bind the connections of internal points, thereby preventing cross-cluster connections and separating weakly-connected clusters. We present an interactive Demo and a brief introduction to the algorithm at https://zpguigroupwhu.github.io/CDC-Introduction-Website/, and develop a CDC toolkit at https://github.com/ZPGuiGroupWhu/ClusteringDirectionCentrality This paper has been published in Nature Communications, and more details can be seen https://www.nature.com/articles/s41467-022-33136-9.
Supported python versions are 3.8 and above.
This project has been uploaded to PyPI, supporting direct download and installation from pypi
pip install cdc-cluster
git clone https://github.com/ZPGuiGroupWhu/CDC-pkg.git
cd CDC-pkg
pip install -e .
The CDC algorithm is refactored to be a scikit-learn compatible estimator. It provides both a class-based interface CDC and a function-based interface cdc_cluster.
from cdc_cluster import CDC
import numpy as np
import matplotlib.pyplot as plt
from sklearn.datasets import make_moons

# Generate sample data
X, _ = make_moons(n_samples=200, noise=0.05, random_state=42)

# Initialize and fit CDC
# n_neighbors: Number of nearest neighbors to consider (k_num)
# ratio: Ratio for determining the DCM threshold
cdc = CDC(n_neighbors=20, ratio=0.9)
cdc.fit(X)

# Get cluster labels
# Labels start from 0. Noisy samples are labeled as -1.
labels = cdc.labels_

# Plot result
plt.scatter(X[:, 0], X[:, 1], c=labels, cmap='viridis')
plt.title("CDC Clustering Result")
plt.show()from cdc_cluster import cdc_cluster
from sklearn.datasets import make_blobs
X, _ = make_blobs(n_samples=200, centers=3, random_state=42)
# Compute clustering directly
# Returns an array of cluster labels
labels = cdc_cluster(X, n_neighbors=20, ratio=0.9)
print(f"Number of clusters: {len(set(labels)) - (1 if -1 in labels else 0)}")Peng, D., Gui, Z.*, Wang, D. et al. Clustering by measuring local direction centrality for data with heterogeneous density and weak connectivity. Nat. Commun. 13, 5455 (2022). https://www.nature.com/articles/s41467-022-33136-9
This project is covered under the MIT License.