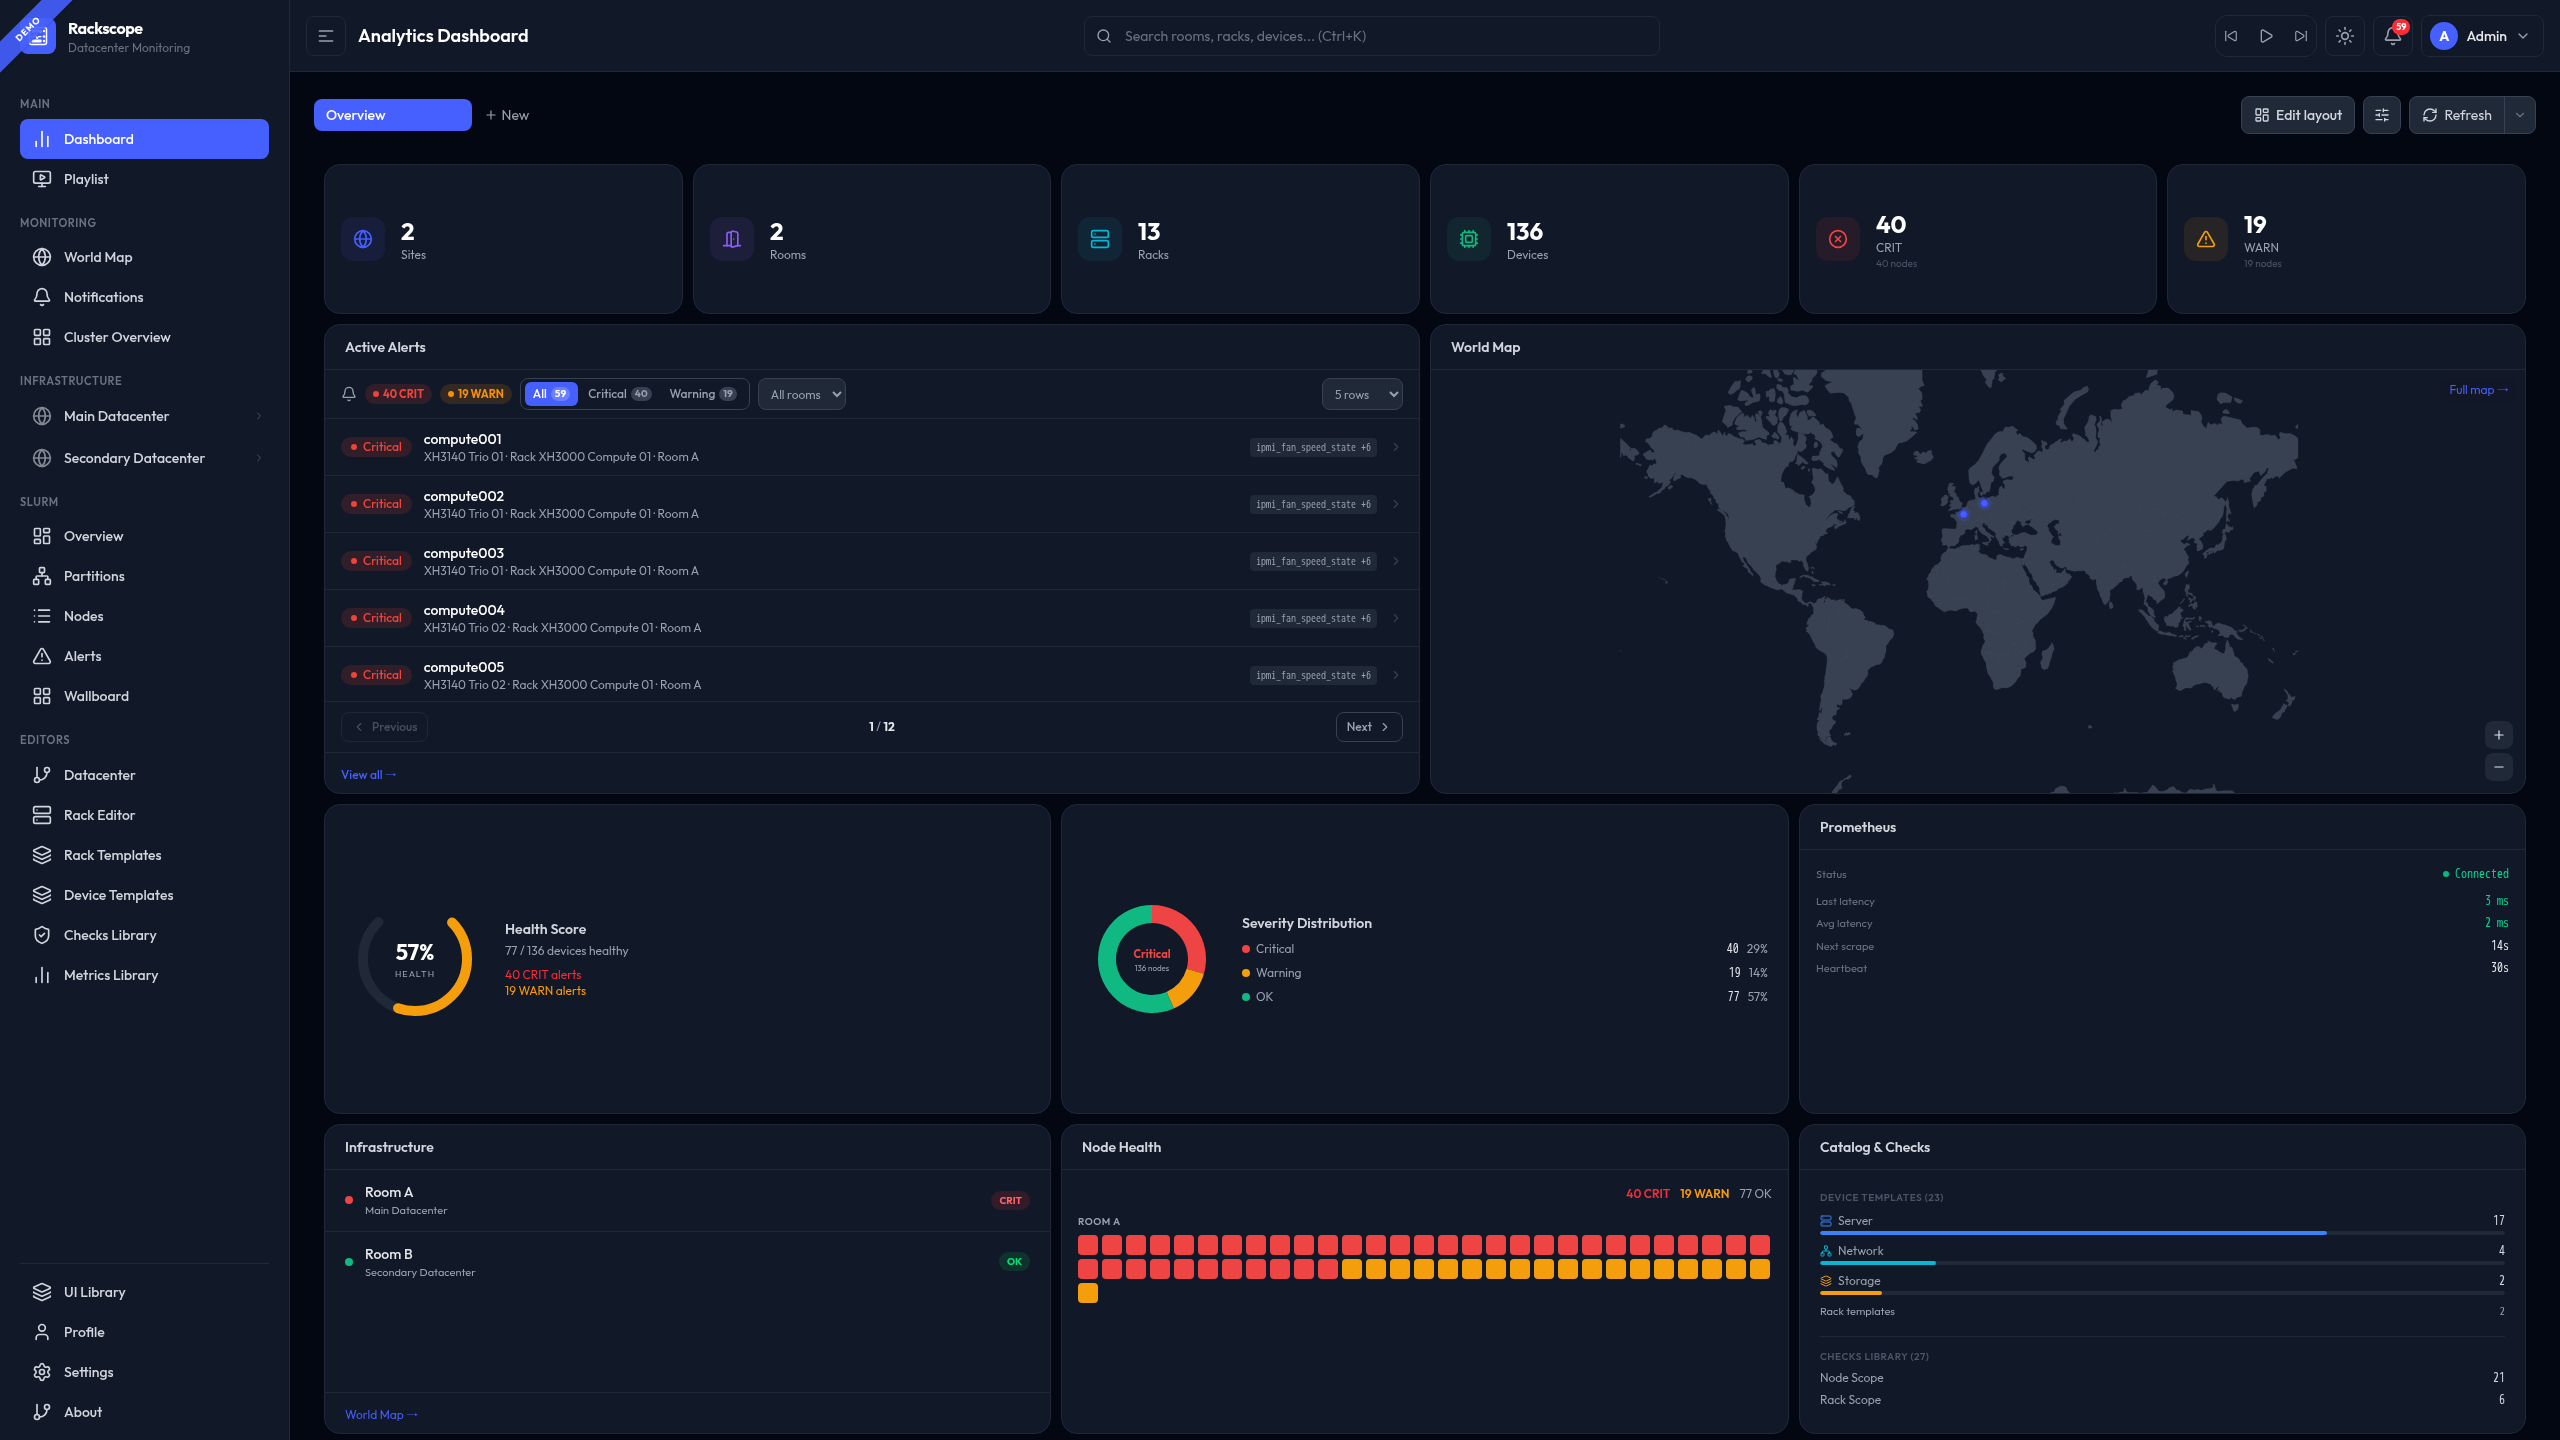
When an alert fires — know exactly where it is. From world map to rack slot, in real time.





World Map → Room → Rack → Device → Instance
                 ↑ Prometheus alerts · real-time
-
Define your templates Describe your hardware once — servers, switches, storage arrays, PDUs. Each model defines the physical form, layout, and associated metrics. YAML or visual editor.
-
Create your checks and assign them Define PromQL health rules and assign them to device or rack templates. Checks use the standard Prometheus HTTP API — compatible with Thanos, Grafana Mimir, Cortex, VictoriaMetrics, and any backend exposing
/api/v1/query. -
Build your topology Map your physical infrastructure: datacenters, rooms, aisles, racks, devices. YAML or visual editor — no database, no agent to deploy.
-
Visualize and locate Rackscope displays the health of every piece of equipment in real time. When a node goes down, an alert appears in the notification panel — and is also reflected visually in the dashboards. The rack containing the faulty equipment changes color to match the alert severity, making it immediately visible at a glance. This propagates up through multi-room and multi-datacenter views, giving you a complete, at-a-glance visual overview of your entire infrastructure.
An interactive, real-time view of your entire physical infrastructure — every level visible, every alert instantly locatable.
🗺️ Physical views
- World map with site markers
- Room floor plan — 10 styles
- Front/rear rack elevation
- Device drill-down & metrics
- NOC wallboard · HPC cluster view
⚡ Health
- PromQL checks — node → rack → room → site propagation
- WARN / CRIT / UNKNOWN states
- Per-component monitoring (
expand_by_label) - Toast + sound alerts
🛠️ Editors
- Topology editor (sites, rooms, aisles, racks)
- Rack editor (drag & drop)
- Templates editor (Monaco)
- Checks library · Settings UI — no YAML required
Requirements: Docker & Docker Compose only.
git clone https://github.com/SckyzO/rackscope.git
cd rackscope
make up| Service | URL |
|---|---|
| 🖥️ Web UI | http://localhost:5173 |
| 📖 API Docs | http://localhost:8000/docs |
| 📊 Prometheus | http://localhost:9090 |
Bundled examples (no hardware required):
make use CONFIG=homelab        #     23 nodes
make use CONFIG=small-cluster  #    608 nodes
make use CONFIG=hpc-cluster    #  1 912 nodes
make use CONFIG=exascale # 14 218 nodes · 3 sitesAll commands run inside Docker — no local Python or Node.js needed.
make up       # Start stack
make lint     # ruff · eslint · prettier
make test     # 1039+ tests
make quality # lint + typecheck + coverageFull documentation at rackscope.dev
Contributions are welcome — please read CONTRIBUTING.md first.
- Code, bugs, features → open an issue
- Documentation → contribute to the rackscope_documentation repo
Rackscope is free and open-source. If it saves you time, consider supporting its development:


AGPL-3.0-or-later — Thomas Bourcey (@SckyzO)
For commercial use or proprietary deployments, contact sckyzo@gmail.com.
Made with ❤️ for datacenter operators and HPC teams