implementation of maximum bipartite matching for job scheduling , stock charts overlaid , partitioning into chains according to a matching
In this problem you will need to guess how to apply the network algorithms to find the most compact way of visualizing stock price data using charts. Problem Description. You are in the middle of writing your newspaper’s end-of-year economics summary, and you’ve decided that you want to show a number of charts to demonstrate how different stocks have performed over the course of the last year. You’ve already decided that you want to show the price of 𝑛 different stocks, all at the same 𝑘 points of the year. A simple chart of one stock’s price would draw lines between the points (0, 𝑝𝑟𝑖𝑐𝑒0), (1, 𝑝𝑟𝑖𝑐𝑒1), . . ., (𝑘−1, 𝑝𝑟𝑖𝑐𝑒𝑘−1), where 𝑝𝑟𝑖𝑐𝑒𝑖 is the price of the stock at the 𝑖th point in time. In order to save space, you have invented the concept of an overlaid chart. An overlaid chart is the combination of one or more simple charts, and shows the prices of multiple stocks (simply drawing a line for each one). In order to avoid confusion between the stocks shown in a chart, the lines in an overlaid chart may not cross or touch. Given a list of 𝑛 stocks’ prices at each of 𝑘 time points, determine the minimum number of overlaid charts you need to show all of the stocks’ prices. Input Format. The first line of the input contains two integers 𝑛 and 𝑘 — the number of stocks and the number of points in the year which are common for all of them. Each of the next 𝑛 lines contains 𝑘 integers. The 𝑖th of those 𝑛 lines contains the prices of the 𝑖th stock at the corresponding 𝑘 points in the year. Constraints. 1 ≤ 𝑛 ≤ 100; 1 ≤ 𝑘 ≤ 25. All the stock prices are between 0 and 1,000,000. Output Format. Output a single integer, the minimum number of overlaid charts to visualize all the stock price data you have, and a visual representation of the solution.
Sample.
Input:
3 4
1 2 3 4
2 3 4 6
6 5 4 3
Output:
2
This data can be put into two following overlaid charts.
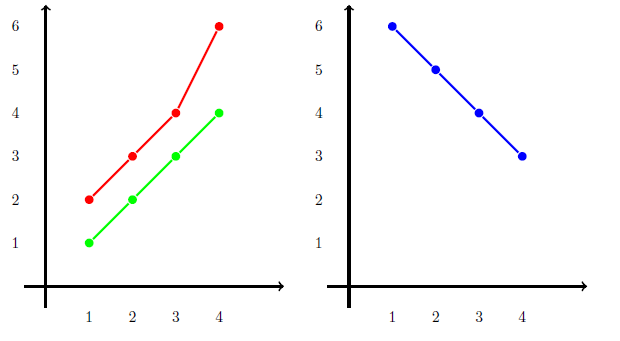
However, we cannot put all the data in one overlaid chart, as the lines corresponding to the third stock would touch the lines corresponding to the second stock, because they have the same price value at the third point.
What to Do. Try to reduce the problem to the maximum matching in a bipartite graph problem and use a proper algorithm to tackle it.